

Chart Elements
The Chart Elements commands described below can be accessed from the Chart Elements section of the Data Discovery/Chart tab.
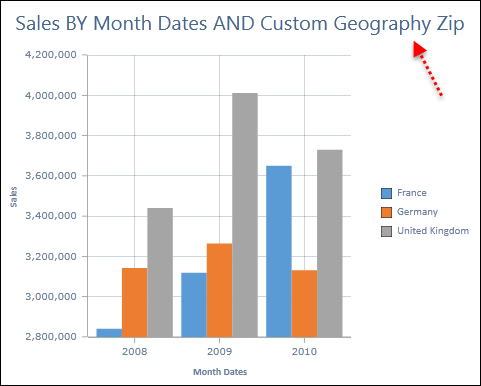
Chart Title
You can hide/show the chart title.
- Single Chart titles can be generated automatically or customized.
- The content of Multi-Chart titles is always generated automatically.
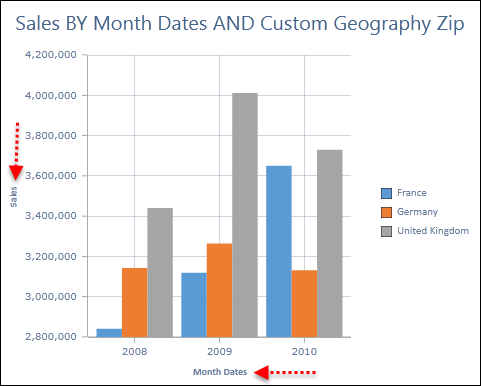
Axis Titles
Axis titles may be generated automatically or customized. You can hide/show/format axes titles for:
- Primary Y-Axis
- Secondary Y-Axis
- X-Axis
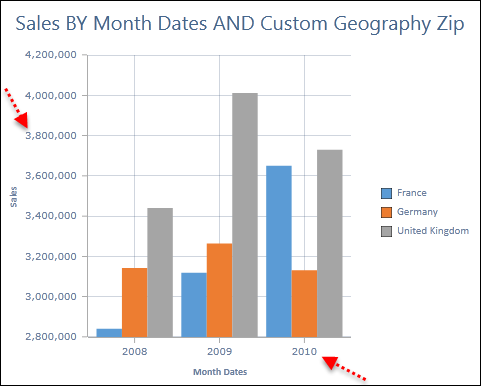
Axes
You can control axes labels and axes lines separately for:
- Primary Y-Axis
- Secondary Y-Axis
- X-Axis
Axis labels show categories (x-axis) and values (y-axis) for standard charts. If the labels do not fit, they are displayed every n-th item, where the n factor depends on available spacing.
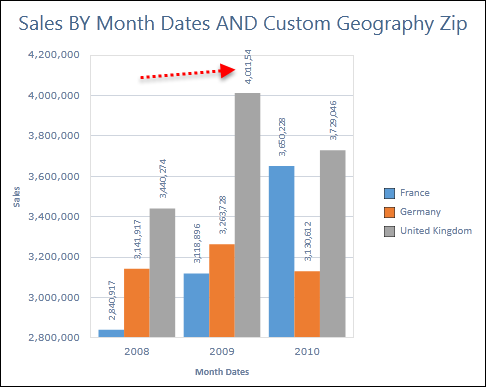
Data Labels
You can hide/show/format data labels. Data labels can be configured to represent:
- Values
- Percentages
- Series Names
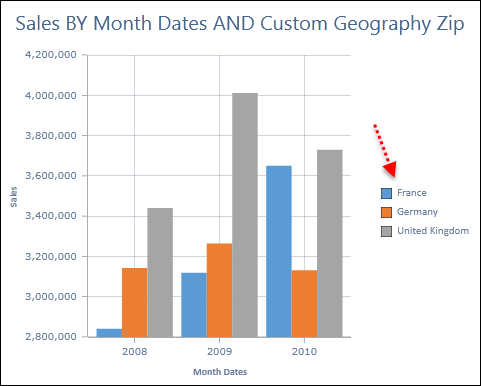
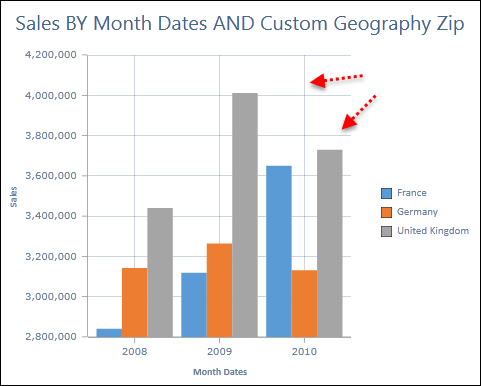
Legend Options
The legend can be placed at left, right, top or bottom of the chart. The legend displays the series which are typically taken from the columns of the query.
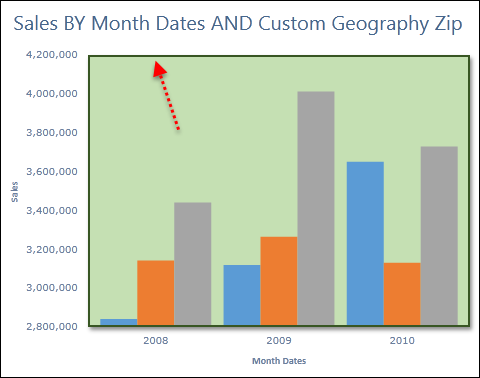
Plot Area
You can hide/show/format the plot border.
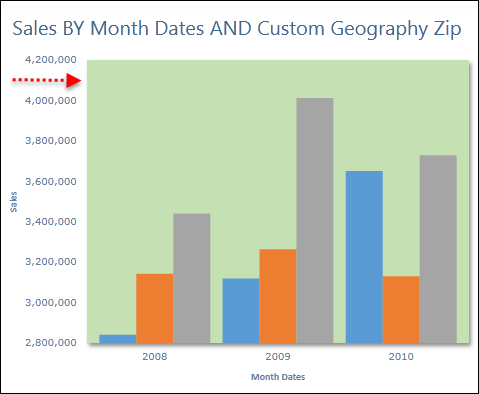
You can also hide/show/format the plot border.
Grid Lines
You can control and format the x/y grid lines separately.
Home |
Table of Contents |
Index |
User Community
Pyramid Analytics © 2011-2022